

Comprehensive Guide to Supply Chain Planning Metrics
.png)
Comprehensive Guide to Supply Chain Planning Metrics
Supply chain disruptions, inventory shortages, and transportation in a globalized marketplace are some of the few challenges supply chain leaders are in a constant battle with. Unimpeded supply chain operations are the lifeblood of any organization, and aligning all the moving parts can be a daunting and complex affair. The only way companies can ensure smooth operations is to align procurement, production, transportation, and customer serviceability by keeping a close eye on key supply chain metrics.
Monitoring a set of very specific and unified metrics throughout the supply chain planning process is crucial for improving organizational alignment and enables agility, ultimately leading to greater customer satisfaction. By tracking key metrics such as on-time delivery, inventory levels, and order accuracy, organizations can identify areas for improvement, optimize their processes, and make informed decisions about their supply chain.
Many business metrics can be used to measure the performance of a supply chain and to inform planning decisions. Here are a few examples:
Availability
Availability is a term that refers to the ability of a product, service, or resource to be used when it is needed.
availability = demand /inventory levels
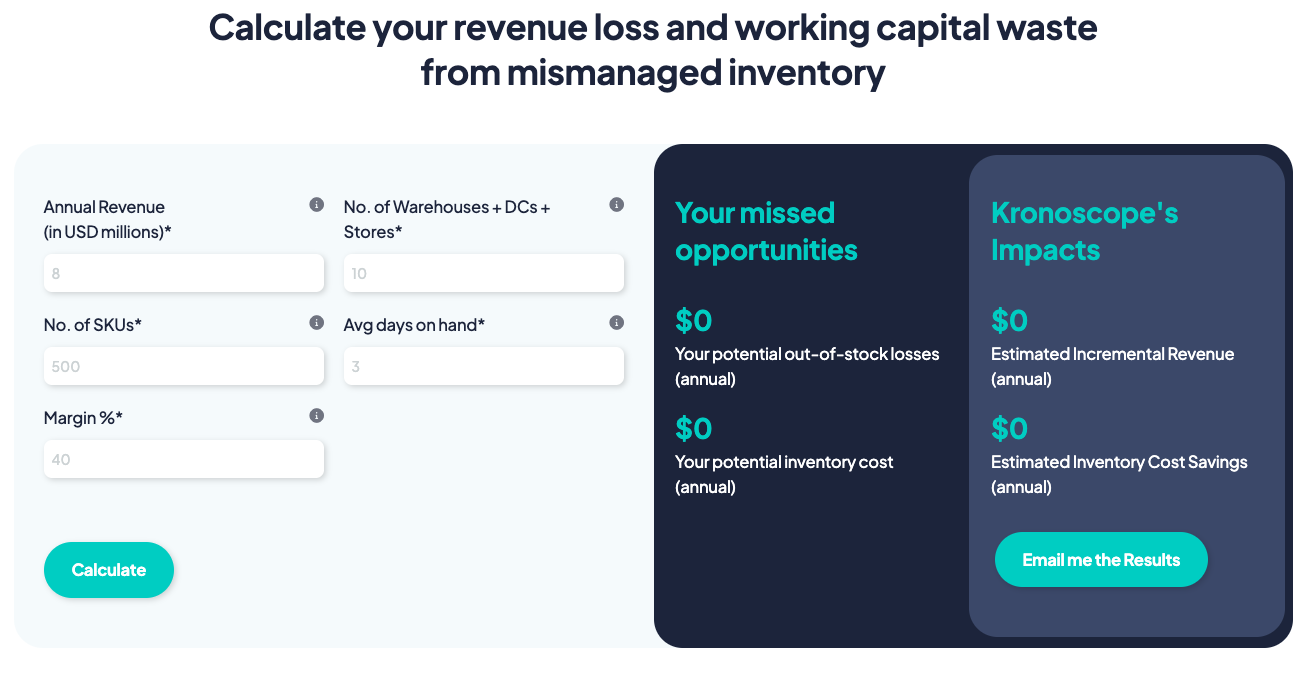
Out-of-stock loss
Stock Outs happen when you run out of inventory and fail to meet the demand for a product. The loss in potential revenue associated with stockouts is called out-of-stock-losses.
Inventory Overstocking
When companies tend to store inventory that is not being sold, it ties up working capital that could be used for other operational activities. Inaccurate demand and inventory planning is one the major causes of an inventory pileup. Companies should invest in an automated control tower mechanism that provides proactive alerts on inventory pileup situations throughout the supply chain.
Wastage /Shrinkage
Wastage in a supply chain can occur for a variety of reasons, such as damage to goods during transportation, expiration of perishable items, or overproduction. Shrinkage is used to describe the difference between the expected or recorded inventory on hand and the actual physical count of the inventory. It can occur for various reasons, such as theft, error in the inventory management system, or damage to goods. Wastage/Shrinkage can have a significant impact on a company's bottom line, as it represents a loss of goods that could have been sold.
Wastege= (Waste/Sales)X100
Inventory turns ratio
The inventory turn ratio measures how efficiently a company manages its inventory. It is calculated by dividing the cost of goods sold (COGS) by the average inventory for a given period of time.
A high inventory turn ratio is generally seen as a positive sign, as it indicates that the company is efficiently managing its inventory and able to sell its products quickly. A low inventory turn ratio may suggest that the company is struggling to sell its products or is carrying too much inventory, which can tie up financial resources and increase the risk of inventory becoming obsolete.
Inventory turnover rate = cost of goods sold / average inventory
Sell-through rate
The sell-through rate is a measure of the percentage of units of a product that are sold in a given period of time. It is typically used to assess the performance of a product in the market. It can be calculated by dividing the number of units sold by the number of units available for sale.
The sell-through rate is often used in retail to assess the demand for a particular product or to set sales targets. It can also be used by manufacturers to gauge the success of a product in the market and to make production and inventory management decisions.
Sell-through rate = (units sold / units available for sale) x 100
% of products with low availability
The percentage of products with low availability can be calculated by dividing the number of products with low availability by the total number of products, then multiplying by 100 to express the result as a percentage.
Low availability can refer to various things, depending on the context. It could mean that there are only a few units of a product in stock, that a product is out of stock, or that a product is in short supply. In any case, a high percentage of products with low availability may indicate that a company is struggling to keep up with demand or that it is having difficulties with its inventory management.
Here's the formula:
% of products with low availability = (number of products with low availability / total number of products) x 100
Inventory carrying cost
Inventory carrying cost, also known as the cost of holding inventory, is the total cost associated with holding or storing inventory. It includes a variety of expenses, such as the cost of storage (e.g., warehouse rent), insurance, taxes, and shrinkage (e.g., damage or theft).
Inventory carrying cost is an important consideration for businesses because it can be a significant portion of their operating expenses. It is important for businesses to strike a balance between maintaining enough inventory to meet demand while also minimizing their carrying costs.
Inventory carrying costs = [(inventory service costs + inventory risk costs + capital cost + storage cost) / total inventory value] x 100
Productivity gains - time saved over manual planning
Businesses can overcome the challenges, shortcomings, and associated frustration that comes with relying on manual processes of demand prediction by adopting a more automated approach to planning, i.e., Demand Sensing. Developing and investing in demand sensing and inventory planning capability help companies to identify changing demand patterns more quickly and accurately.
The entire supply chain planning process should focus around balancing the demand planning and supply planning and monitoring the supply chain health.
Demand Planning
Demand Sensing is the new-age method of utilizing AI/ML, IoT, and other advanced technologies to provide more accurate, real-time demand predictions. It takes demand forecasting to the next level by considering short-term trends and incorporating baseline data adjusted for external and internal factors to create an ever-evolving real-time demand forecast. Demand Sensing provides higher accuracy in demand predictions and day-by-day sensing by leveraging a high level of data granularity to analyze daily demand information as close as possible to the end customer and immediately detect changes in demand behavior. Forecast predictions are important in the supply chain because they help businesses plan for the future. Accurate forecasting allows companies to predict demand for their products, which in turn helps them to manage their inventory levels and production schedules more efficiently. This can help reduce the risk of running out of stock or producing too much, which can lead to lost sales or excess inventory costs.
Forecasting accuracy
Demand prediction accuracy can be calculated via WMAPE. Weighted mean absolute percentage error, commonly referred to as WMAPE, is a way to measure the error in demand forecasts compared to the actual or real outcomes for a sample.
wMAPE can be calculated as follows:
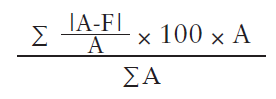
Here: A = Actual, F = Forecast
Let's say a company is forecasting the demand for their products over the next month. They make three products: Product A, Product B, and Product C.
- The actual demand for Product A is 100 units
- The forecasted demand for Product A is 90 units
- The actual demand for Product B is 50 units
- The forecasted demand for Product B is 60 units
- The actual demand for Product C is 200 units
- The forecasted demand for Product C is 210 units
As per the formula of the wMAPE, the wMAPE for this scenario is 8.5%. This means that the forecast is off by an average of 8.5%across all three products.
Gauge Actual Demand
Actual Demand or unconstrained demand refers to the level of demand for a product or service that is not limited by any internal factors. It represents the true level of demand that a company could potentially receive for its product that is not affected by out-of-stock events. To ascertain unconstrained demand, historical sales, seasonal effects, and product cyclicity data are viewed through the perspective of historical inventory data. Learnings for low sales data due to out-of-stock events are penalized and excluded from predictions. Therefore, the unconstrained demand prediction remains close to the actual demand.

Supply Planning
Traditionally, operations managers create purchase plans manually and evaluate suppliers based on factors such as price, quality, location, reliability, and previous experience. These aspects hold good as a general rule. However, the highly volatile and unpredictable demand levels make effective supply planning difficult. Managers are in a quandary when it comes to making decisions in real-time to plan supply effectively. Further, it becomes taxing to continuously evaluate thousands of suppliers across hundreds of SKUs manually and identify the ideal supplier. This may lead to choosing the wrong supplier resulting in understocking or overstocking.
Fill rates
Supplier service level is the percentage of orders a supplier has generally filled on average. This metric is calculated using historical purchase and GRN data at the individual SKU-vendor level. Fill rates are used to adjust safety buffers. If fill rates become lower (that indicates supply-side variability), then safety buffers will increase to cushion the impact of this variance.
Supplier Fill Rates = (Fulfilled orders quantity / Total orders quantity) x 100
Lead Times
Supplier lead time is the amount of time it takes for a supplier to fulfill an order and deliver the product to the customer. This can include the time it takes for the supplier to process the order, manufacture the product, and transport the product to the customer.
Supplier lead time is an important factor to consider in supply chain management, as it can impact the overall lead time for a product and affect inventory availability. Long supplier lead times can cause delays in production or delivery to customers, while short supplier lead times can reduce inventory carrying costs and improve responsiveness to customer demand.
For manufacturers, the lead time formula is
Total Lead Time = Procurement Time + Manufacturing Time + Shipping Time
For retailers, the lead time formula is
Total Lead Time = Procurement Time + Shipping Time
Inventory Holding days
Days on hand (DOH) is a measure used in supply chain planning to indicate how long a company's inventory will last, based on the current rate of consumption. It is calculated by dividing the current inventory levels by the average daily sales quantity rate during that period.
Here's the formula:
Days of inventory on hand = (current inventory/average daily sales quantity for the period)
The norm of DOH is different for each company and industry, but generally, it is important to maintain a recommended DOH to meet customer demand and avoid stockouts while also keeping inventory carrying costs low. A company should aim to maintain a DOH that balances these two objectives.
Safety Stock
Safety Stock is a level of inventory that a company maintains to mitigate the risk of stockouts (running out of inventory) due to unexpected demand or supply disruptions. It is a buffer stock that is kept on hand to ensure that a company can continue to fulfill customer orders even if there are unexpected delays or changes in demand.
Safety stock is determined by considering the lead time for replenishing inventory, the variability of demand, and the desired level of customer service. For example, a company with a long lead time for replenishing inventory and high demand variability may need to maintain a higher level of safety stock than a company with a shorter lead time and more stable demand.
How is it calculated?
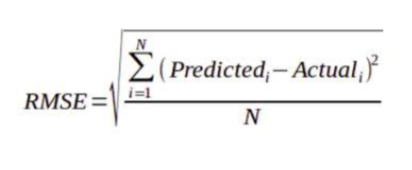
Safety stock= (Root mean square error of forecast compared to actuals) * (service level multiplier) * (Plan coverage days)
Users should also take supplier lead times and supplier fill rates into account while calculating the safety stock. If lead times variability is higher or the fill rate lower, we suggest holding higher safety stock to provide an additional buffer for supply variability.
RMSE is calculated as the square root of the average squared difference between actuals and predictions at a daily level.
In conclusion, effective supply chain planning is essential for ensuring smooth operations and meeting customer needs. Key metrics such as on-time delivery, inventory levels, and order accuracy can help organizations identify areas for improvement and optimize their processes. Automated approaches like demand sensing can also improve demand prediction and enable more agile decision-making. However, it is important for companies to also consider the potential challenges of inventory pileup, out-of-stock loss, and revenue leakage due to wastage or shrinkage. By carefully monitoring and managing these metrics and challenges, businesses can improve their overall supply chain performance and drive customer satisfaction.

Comprehensive Guide to Supply Chain Planning Metrics
Supply chain disruptions, inventory shortages, and transportation in a globalized marketplace are some of the few challenges supply chain leaders are in a constant battle with. Unimpeded supply chain operations are the lifeblood of any organization, and aligning all the moving parts can be a daunting and complex affair. The only way companies can ensure smooth operations is to align procurement, production, transportation, and customer serviceability by keeping a close eye on key supply chain metrics.
Monitoring a set of very specific and unified metrics throughout the supply chain planning process is crucial for improving organizational alignment and enables agility, ultimately leading to greater customer satisfaction. By tracking key metrics such as on-time delivery, inventory levels, and order accuracy, organizations can identify areas for improvement, optimize their processes, and make informed decisions about their supply chain.
Many business metrics can be used to measure the performance of a supply chain and to inform planning decisions. Here are a few examples:
Availability
Availability is a term that refers to the ability of a product, service, or resource to be used when it is needed.
availability = demand /inventory levels
Out-of-stock loss
Stock Outs happen when you run out of inventory and fail to meet the demand for a product. The loss in potential revenue associated with stockouts is called out-of-stock-losses.
Inventory Overstocking
When companies tend to store inventory that is not being sold, it ties up working capital that could be used for other operational activities. Inaccurate demand and inventory planning is one the major causes of an inventory pileup. Companies should invest in an automated control tower mechanism that provides proactive alerts on inventory pileup situations throughout the supply chain.
Wastage /Shrinkage
Wastage in a supply chain can occur for a variety of reasons, such as damage to goods during transportation, expiration of perishable items, or overproduction. Shrinkage is used to describe the difference between the expected or recorded inventory on hand and the actual physical count of the inventory. It can occur for various reasons, such as theft, error in the inventory management system, or damage to goods. Wastage/Shrinkage can have a significant impact on a company's bottom line, as it represents a loss of goods that could have been sold.
Wastege= (Waste/Sales)X100
Inventory turns ratio
The inventory turn ratio measures how efficiently a company manages its inventory. It is calculated by dividing the cost of goods sold (COGS) by the average inventory for a given period of time.
A high inventory turn ratio is generally seen as a positive sign, as it indicates that the company is efficiently managing its inventory and able to sell its products quickly. A low inventory turn ratio may suggest that the company is struggling to sell its products or is carrying too much inventory, which can tie up financial resources and increase the risk of inventory becoming obsolete.
Inventory turnover rate = cost of goods sold / average inventory
Sell-through rate
The sell-through rate is a measure of the percentage of units of a product that are sold in a given period of time. It is typically used to assess the performance of a product in the market. It can be calculated by dividing the number of units sold by the number of units available for sale.
The sell-through rate is often used in retail to assess the demand for a particular product or to set sales targets. It can also be used by manufacturers to gauge the success of a product in the market and to make production and inventory management decisions.
Sell-through rate = (units sold / units available for sale) x 100
% of products with low availability
The percentage of products with low availability can be calculated by dividing the number of products with low availability by the total number of products, then multiplying by 100 to express the result as a percentage.
Low availability can refer to various things, depending on the context. It could mean that there are only a few units of a product in stock, that a product is out of stock, or that a product is in short supply. In any case, a high percentage of products with low availability may indicate that a company is struggling to keep up with demand or that it is having difficulties with its inventory management.
Here's the formula:
% of products with low availability = (number of products with low availability / total number of products) x 100
Inventory carrying cost
Inventory carrying cost, also known as the cost of holding inventory, is the total cost associated with holding or storing inventory. It includes a variety of expenses, such as the cost of storage (e.g., warehouse rent), insurance, taxes, and shrinkage (e.g., damage or theft).
Inventory carrying cost is an important consideration for businesses because it can be a significant portion of their operating expenses. It is important for businesses to strike a balance between maintaining enough inventory to meet demand while also minimizing their carrying costs.
Inventory carrying costs = [(inventory service costs + inventory risk costs + capital cost + storage cost) / total inventory value] x 100
Productivity gains - time saved over manual planning
Businesses can overcome the challenges, shortcomings, and associated frustration that comes with relying on manual processes of demand prediction by adopting a more automated approach to planning, i.e., Demand Sensing. Developing and investing in demand sensing and inventory planning capability help companies to identify changing demand patterns more quickly and accurately.
The entire supply chain planning process should focus around balancing the demand planning and supply planning and monitoring the supply chain health.
Demand Planning
Demand Sensing is the new-age method of utilizing AI/ML, IoT, and other advanced technologies to provide more accurate, real-time demand predictions. It takes demand forecasting to the next level by considering short-term trends and incorporating baseline data adjusted for external and internal factors to create an ever-evolving real-time demand forecast. Demand Sensing provides higher accuracy in demand predictions and day-by-day sensing by leveraging a high level of data granularity to analyze daily demand information as close as possible to the end customer and immediately detect changes in demand behavior. Forecast predictions are important in the supply chain because they help businesses plan for the future. Accurate forecasting allows companies to predict demand for their products, which in turn helps them to manage their inventory levels and production schedules more efficiently. This can help reduce the risk of running out of stock or producing too much, which can lead to lost sales or excess inventory costs.
Forecasting accuracy
Demand prediction accuracy can be calculated via WMAPE. Weighted mean absolute percentage error, commonly referred to as WMAPE, is a way to measure the error in demand forecasts compared to the actual or real outcomes for a sample.
wMAPE can be calculated as follows:
Here: A = Actual, F = Forecast
Let's say a company is forecasting the demand for their products over the next month. They make three products: Product A, Product B, and Product C.
- The actual demand for Product A is 100 units
- The forecasted demand for Product A is 90 units
- The actual demand for Product B is 50 units
- The forecasted demand for Product B is 60 units
- The actual demand for Product C is 200 units
- The forecasted demand for Product C is 210 units
As per the formula of the wMAPE, the wMAPE for this scenario is 8.5%. This means that the forecast is off by an average of 8.5%across all three products.
Gauge Actual Demand
Actual Demand or unconstrained demand refers to the level of demand for a product or service that is not limited by any internal factors. It represents the true level of demand that a company could potentially receive for its product that is not affected by out-of-stock events. To ascertain unconstrained demand, historical sales, seasonal effects, and product cyclicity data are viewed through the perspective of historical inventory data. Learnings for low sales data due to out-of-stock events are penalized and excluded from predictions. Therefore, the unconstrained demand prediction remains close to the actual demand.
Supply Planning
Traditionally, operations managers create purchase plans manually and evaluate suppliers based on factors such as price, quality, location, reliability, and previous experience. These aspects hold good as a general rule. However, the highly volatile and unpredictable demand levels make effective supply planning difficult. Managers are in a quandary when it comes to making decisions in real-time to plan supply effectively. Further, it becomes taxing to continuously evaluate thousands of suppliers across hundreds of SKUs manually and identify the ideal supplier. This may lead to choosing the wrong supplier resulting in understocking or overstocking.
Fill rates
Supplier service level is the percentage of orders a supplier has generally filled on average. This metric is calculated using historical purchase and GRN data at the individual SKU-vendor level. Fill rates are used to adjust safety buffers. If fill rates become lower (that indicates supply-side variability), then safety buffers will increase to cushion the impact of this variance.
Supplier Fill Rates = (Fulfilled orders quantity / Total orders quantity) x 100
Lead Times
Supplier lead time is the amount of time it takes for a supplier to fulfill an order and deliver the product to the customer. This can include the time it takes for the supplier to process the order, manufacture the product, and transport the product to the customer.
Supplier lead time is an important factor to consider in supply chain management, as it can impact the overall lead time for a product and affect inventory availability. Long supplier lead times can cause delays in production or delivery to customers, while short supplier lead times can reduce inventory carrying costs and improve responsiveness to customer demand.
For manufacturers, the lead time formula is
Total Lead Time = Procurement Time + Manufacturing Time + Shipping Time
For retailers, the lead time formula is
Total Lead Time = Procurement Time + Shipping Time
Inventory Holding days
Days on hand (DOH) is a measure used in supply chain planning to indicate how long a company's inventory will last, based on the current rate of consumption. It is calculated by dividing the current inventory levels by the average daily sales quantity rate during that period.
Here's the formula:
Days of inventory on hand = (current inventory/average daily sales quantity for the period)
The norm of DOH is different for each company and industry, but generally, it is important to maintain a recommended DOH to meet customer demand and avoid stockouts while also keeping inventory carrying costs low. A company should aim to maintain a DOH that balances these two objectives.
Safety Stock
Safety Stock is a level of inventory that a company maintains to mitigate the risk of stockouts (running out of inventory) due to unexpected demand or supply disruptions. It is a buffer stock that is kept on hand to ensure that a company can continue to fulfill customer orders even if there are unexpected delays or changes in demand.
Safety stock is determined by considering the lead time for replenishing inventory, the variability of demand, and the desired level of customer service. For example, a company with a long lead time for replenishing inventory and high demand variability may need to maintain a higher level of safety stock than a company with a shorter lead time and more stable demand.
How is it calculated?
Safety stock= (Root mean square error of forecast compared to actuals) * (service level multiplier) * (Plan coverage days)
Users should also take supplier lead times and supplier fill rates into account while calculating the safety stock. If lead times variability is higher or the fill rate lower, we suggest holding higher safety stock to provide an additional buffer for supply variability.
RMSE is calculated as the square root of the average squared difference between actuals and predictions at a daily level.
In conclusion, effective supply chain planning is essential for ensuring smooth operations and meeting customer needs. Key metrics such as on-time delivery, inventory levels, and order accuracy can help organizations identify areas for improvement and optimize their processes. Automated approaches like demand sensing can also improve demand prediction and enable more agile decision-making. However, it is important for companies to also consider the potential challenges of inventory pileup, out-of-stock loss, and revenue leakage due to wastage or shrinkage. By carefully monitoring and managing these metrics and challenges, businesses can improve their overall supply chain performance and drive customer satisfaction.
Like what you read?
Subscribe to receive a monthly digest of our most valuable resources like blog posts, whitepapers and much more
.png)
%20(1).png)
.png)